Three big reasons to be happy about the M16 market..
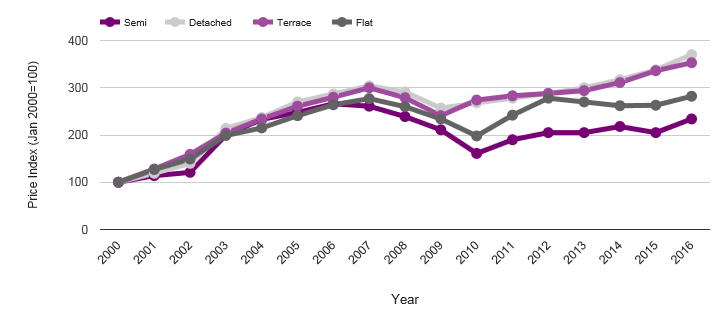
The first and main reason to be happy is illustrated very clearly in the chart above. Long term house price growth in the area has been strong, with the average annual rate of growth since 2000 sitting at an admirable 15.9 per cent. The broad base of the market and the solid fundamentals underpinning it mean we expect this to continue in the medium and long term.
The next reason to be happy is the abundance of liquidity in the market. In laymen’s terms, this means that lots of people are buying and selling and the market isn’t in danger of stagnation. In the second quarter of 2017 (the latest full quarter for which data is available), there were 78 sales. This is 122.9 higher than the same quarter just eight years ago.
Rental returns: Despite former Chancellor George Osborne’s best attempts to slow down the buy-to-let market, the demand for rental property looks like it will increase. There will be plenty of chances for canny landlords thinking about purchasing a buy-to-let property or expanding their portfolio. The current local median monthly rent is £746, which means you could enjoy yields of 7.1 per cent.
With demand for homes increasing, vendors are in a healthy position where they can realistically hope to achieve the asking price, or higher, for their property. When you compare lack of availability to high demand, it seems even more plausible that you will be happy with the final sale price.
The third reason to be happy is the amount of sanity in the national market, which has come about because of more grown-up mortgage regulation. The meteoric rise in prices in the area pre-2008 led to price ‘froth’ building up in the market, which ultimately caused the 2008 crash. While price growth since 2008 has been less rapid, it is far more sustainable and will save us from another crash. Why don’t you pop into our office for more info?
The quarterly sales chart for the local area provides a detailed overview on how the market has performed in the last couple of years. Here we show the total number of property transactions every quarter. This is a useful way to look at how market liquidity has changed since the previous year, whilst accounting for seasonality.
An analysis of monthly changes in house prices should always be taken with a pinch of salt, particularly when looking at very local area. To try to strip out some of the nuances, we’ve displayed flats and houses separately but you’ll see the usual amount of volatility.
Home sizes are a vital gauge of the character of housing stock in a locality. The chart here might surprise you a bit as lots of people think that everyone lives in the same kind of home as them but there are large minorities of people living different types of home.